

DAILY INTERMARKET ANALYSIS (26/06/2026)
S&P 500 Index, Nasdaq 100, Brent Crude Futures, Bloomberg Commodity Index, EuroStoxx 50, U.S. 10‑Year Treasury Yield, Euro / U.S. Dollar, RUSSELL 2000


S&P 500 Index (SPX)
Technical Analysis & Operational Framework
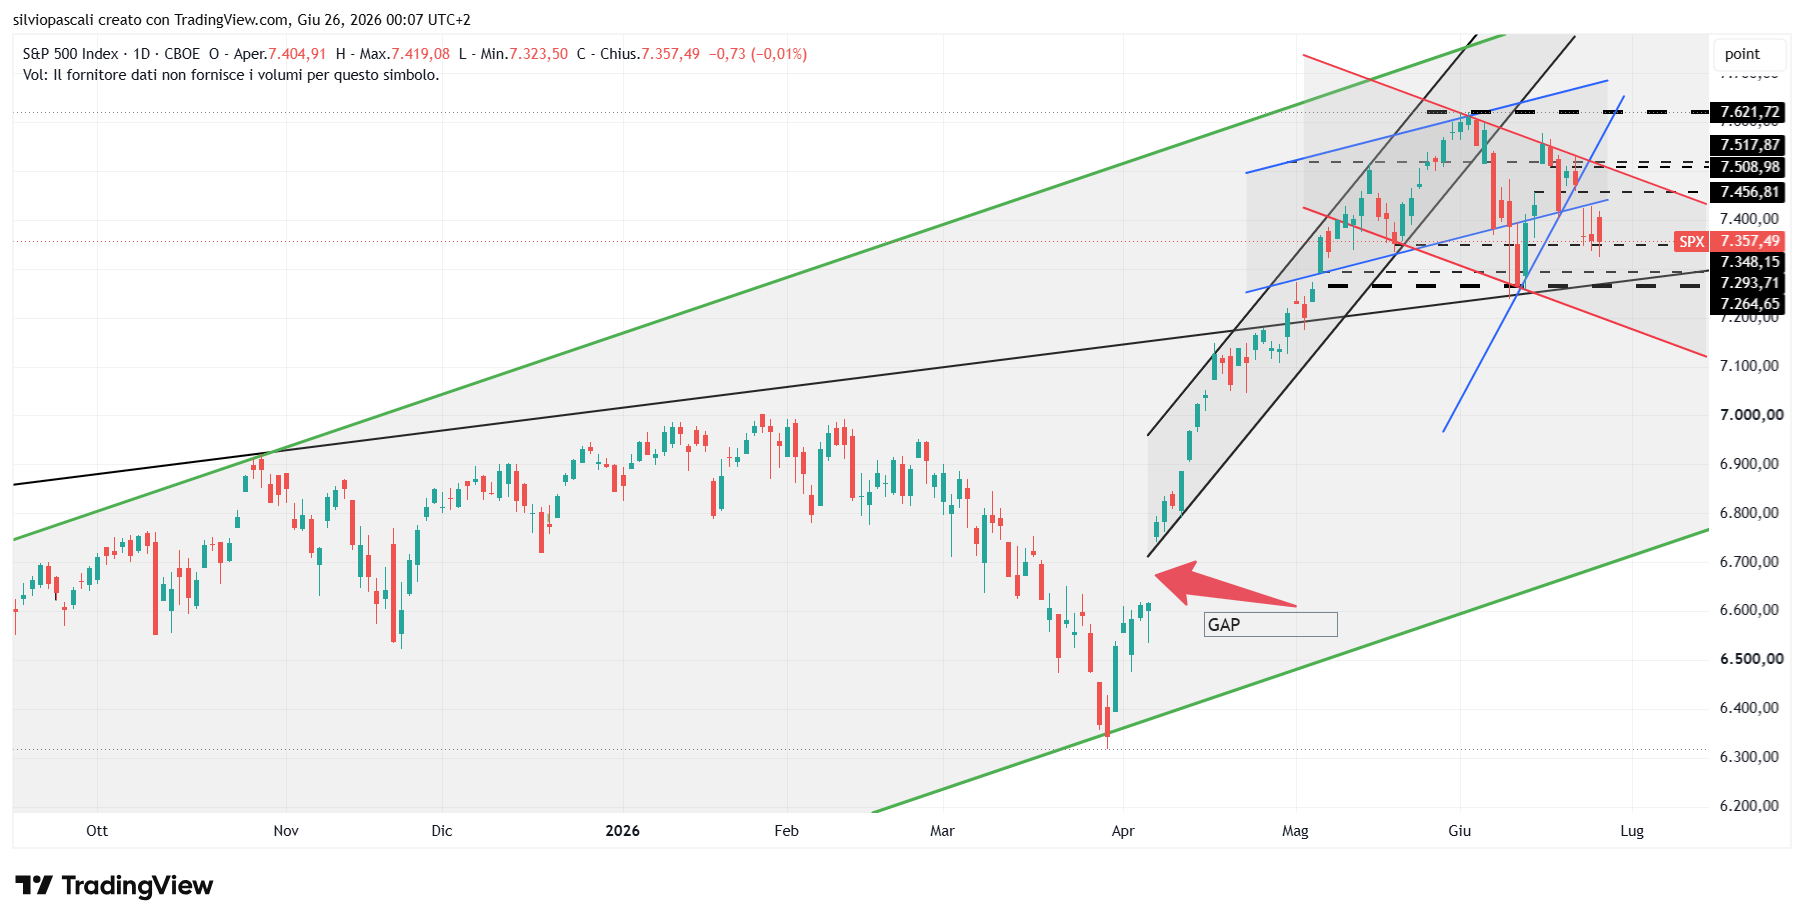
Today’s movement seems minor to us. We are still above the 7348 support. We are in a sideways area, although quite wide, enclosed by the aforementioned support and resistance, and we are at the highs of the American Index. In our view, we cannot yet speak of a structural correction, but the short-term technical picture is certainly set to the downside within our channel (red), which however does not have a steep slope. Therefore, we remain NEUTRAL because the possibility of false signals is very high.
We will refer to the descending channel in red and think that the American Index could first test the 7265 support, then extend further to the base of the channel. Meanwhile, the same channel will serve to provide bullish directional signals, which will activate our bullish scenario only above the resistance in the 7621 area.
Nasdaq 100 Index (NDX)
Technical Analysis & Operational Framework
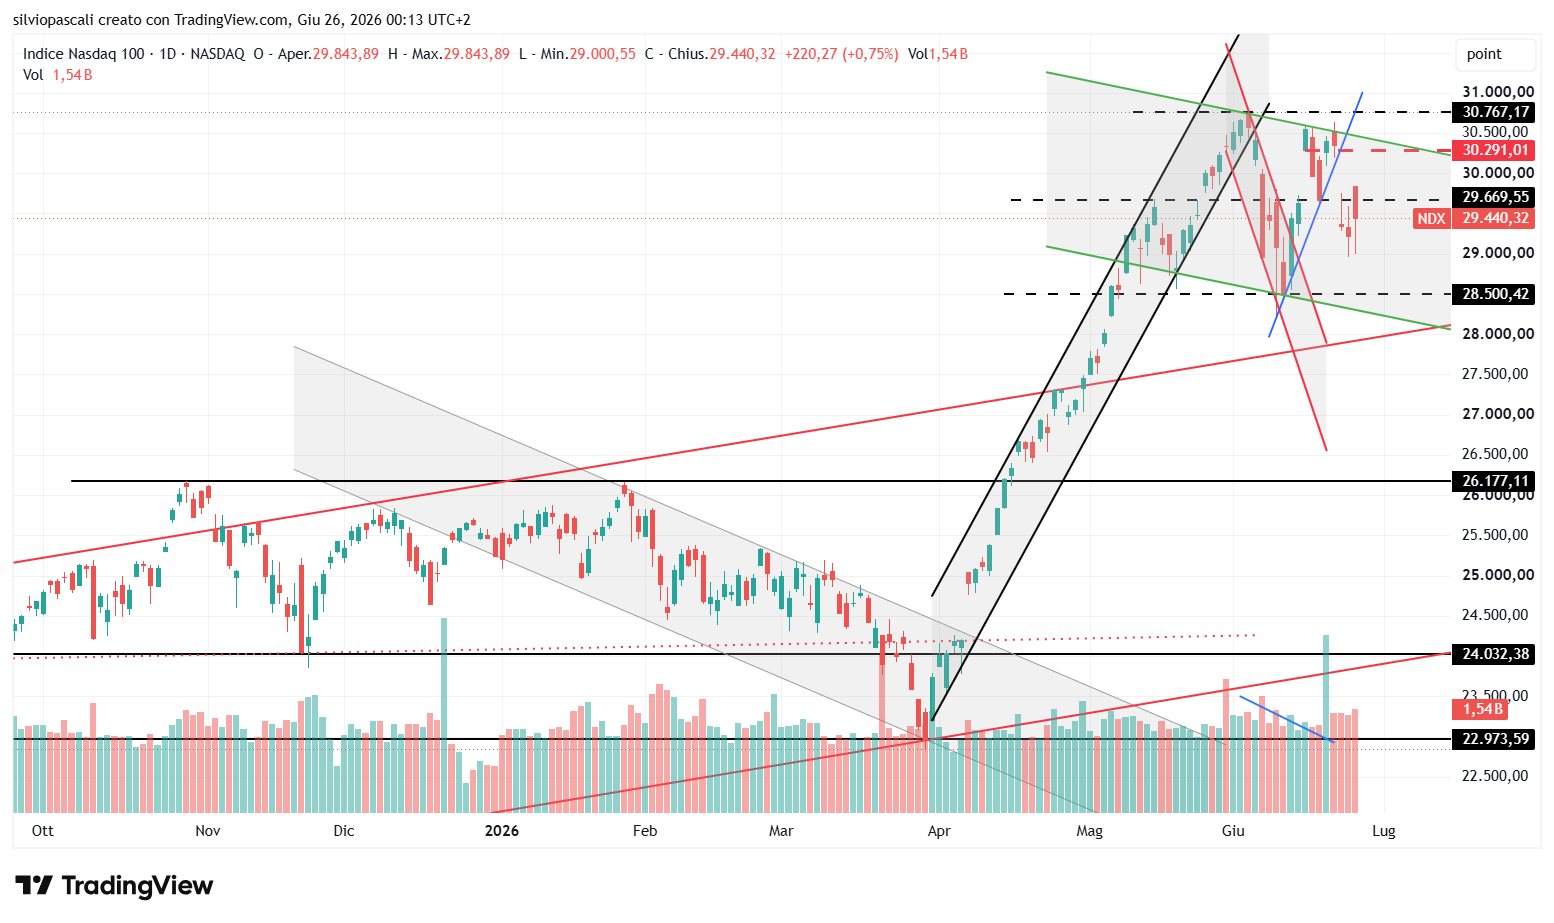
The American tech Index also, despite closing in positive territory, remains below our level in the 29670 area. A gap close above today’s opening would still be possible; however, the short-term technical picture remains set to the downside and the target is the lower part of the channel itself (green on our chart), but first the support at 28500. This latter level is very important because it constitutes the neckline of the double top that we described in recent days. Here too, we remain NEUTRAL.
Brent Crude Oil Futures (BRN1!)
Technical Analysis & Operational Framework
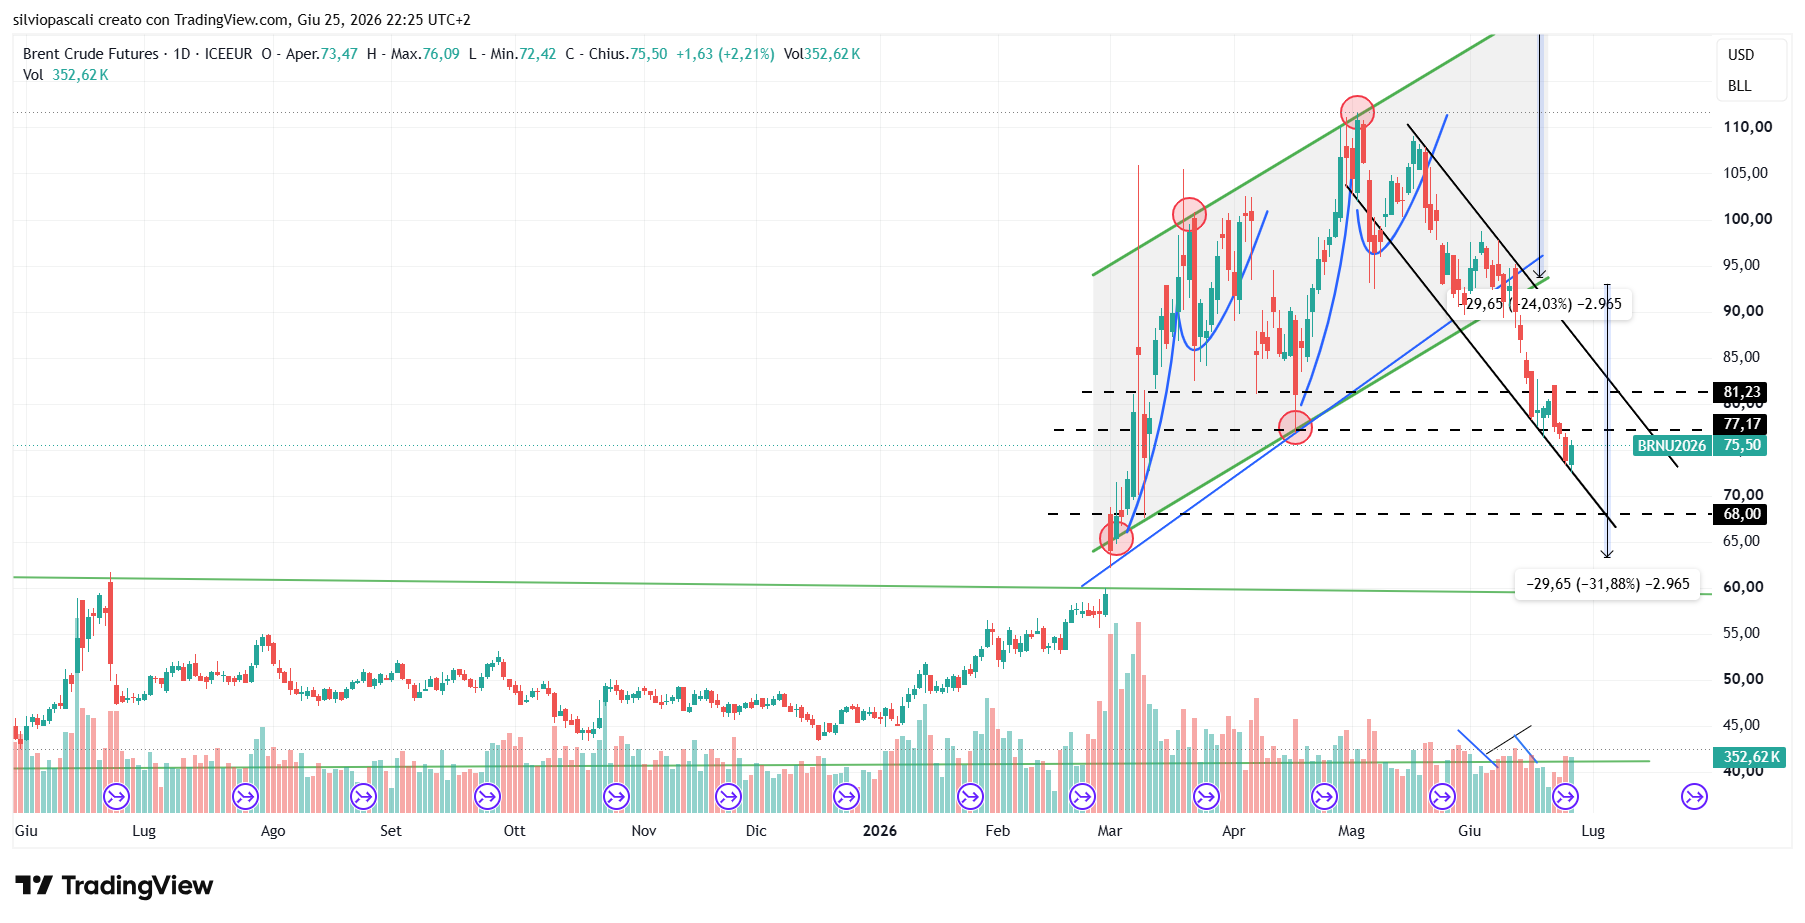
Today’s candle recovers more than half of the body of yesterday’s candle. Watch out for specific reversal movements which, however, do not worry us much as it could be a small pullback to the resistance repeatedly described in the 77.17 area. The technical picture still remains very negative and despite this small signal we remain BEARISH targeting 68 and then 63.4.
Bloomberg Commodity Index (BCOM)
Technical Analysis & Operational Framework
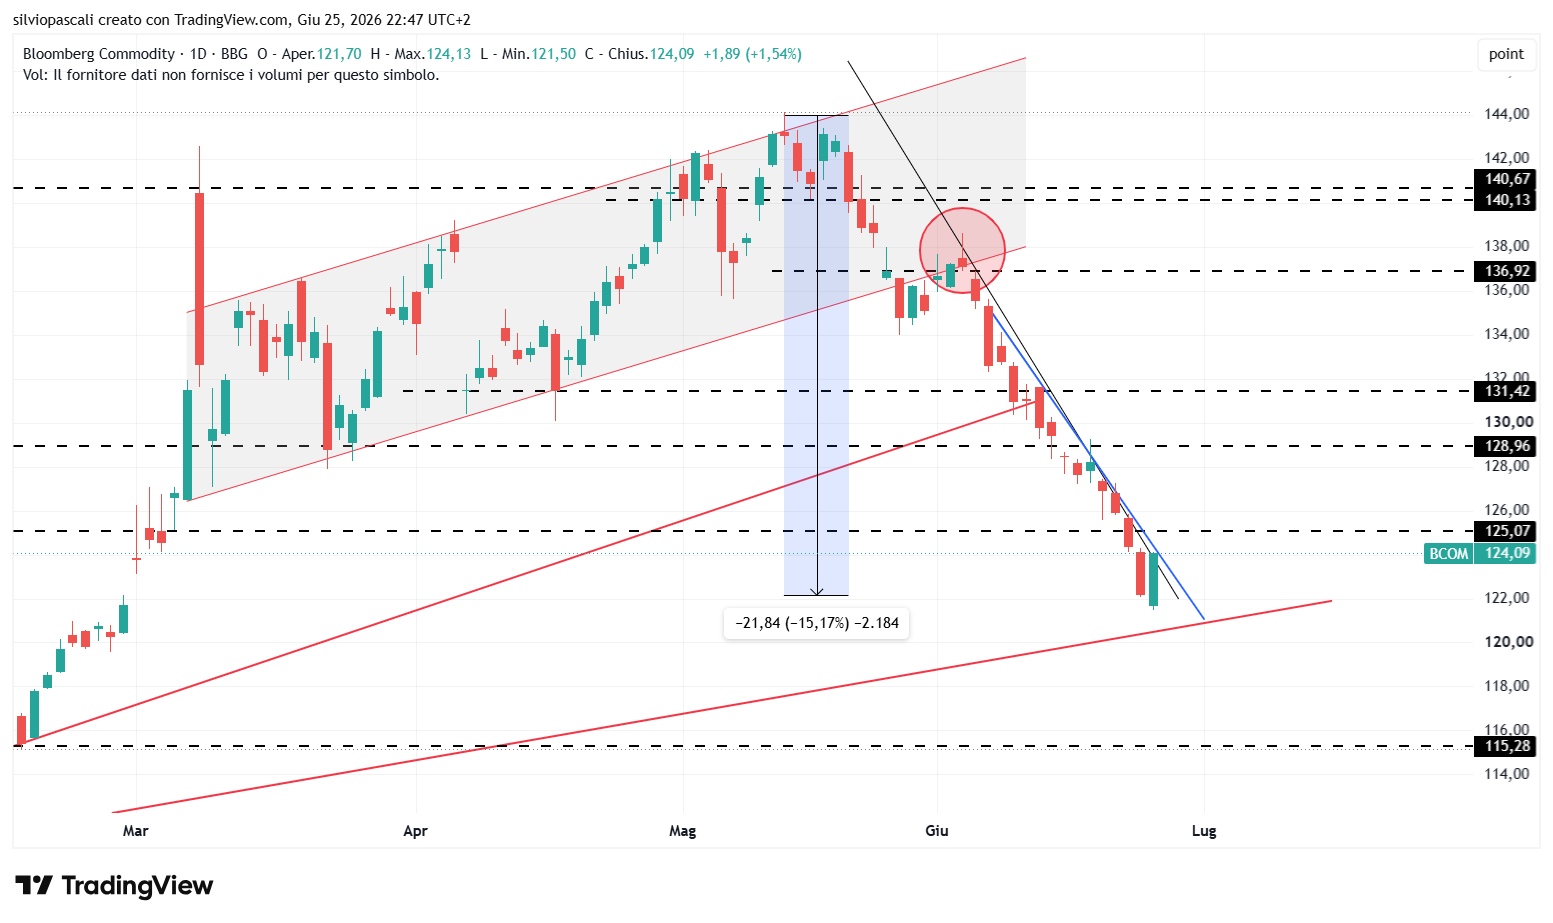
Evaluating the pattern formed over the last two days, we can say that we are in the presence of a bullish engulfing. Tomorrow’s session, with the opening but especially the close above the midpoint of today’s candle body, will confirm the reversal and we will activate our STOP, returning to a NEUTRAL scenario. Otherwise, we will maintain our BEARISH view, referring to our descending trendline on the chart.
Euro Stoxx 50 Index Futures (FESX)
Technical Analysis & Operational Framework
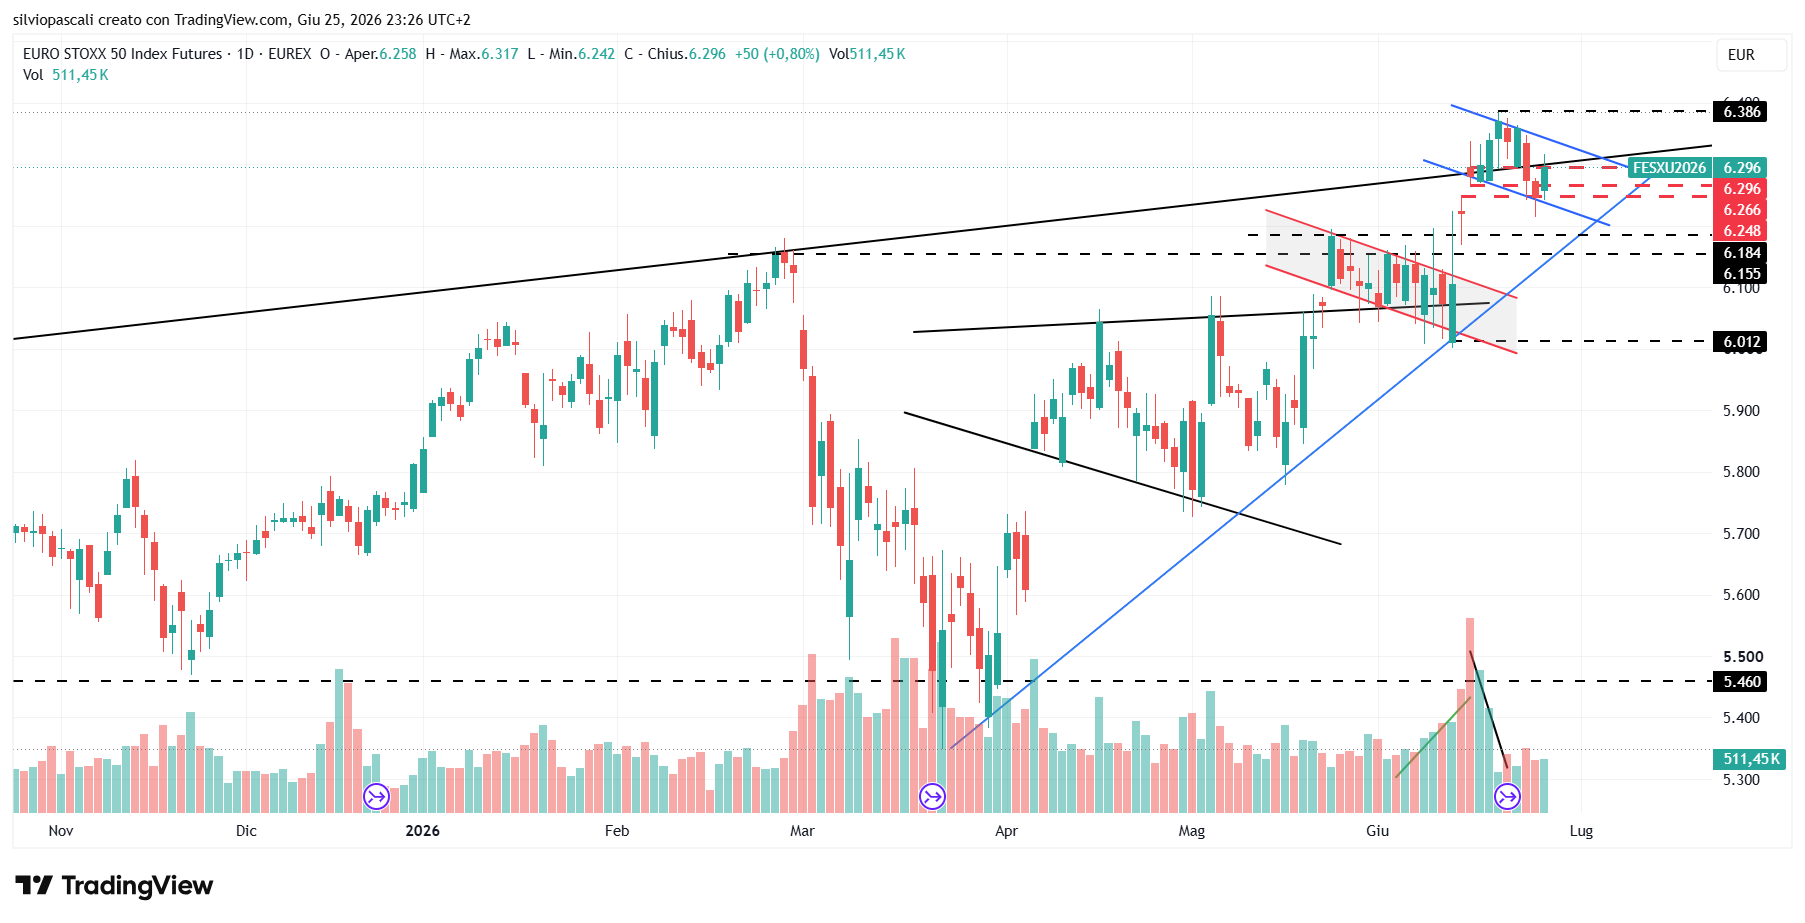
In recent days, we have discussed the difficulty of accurately interpreting market movements day by day. We are not in a correction phase; the European future is definitively very close to its highs. In the short term, what seemed like a small correction could be another bullish flag, and based on this hypothesis, we have constructed a probable channel that has already had three points of contact. We therefore remain NEUTRAL and, as anticipated yesterday, our scenario will become BULLISH upon the violation of the static resistance in the 6386 area, though a breakout to the upside of the flag could already be a good signal. On the contrary, we will activate our BEARISH view upon the downside break of the rising trendline (in blue on our chart), but here too, the break of the blue channel will be an excellent directional signal.
FTSE MIB Index Futures (FIB1!)
Technical Analysis & Operational Framework
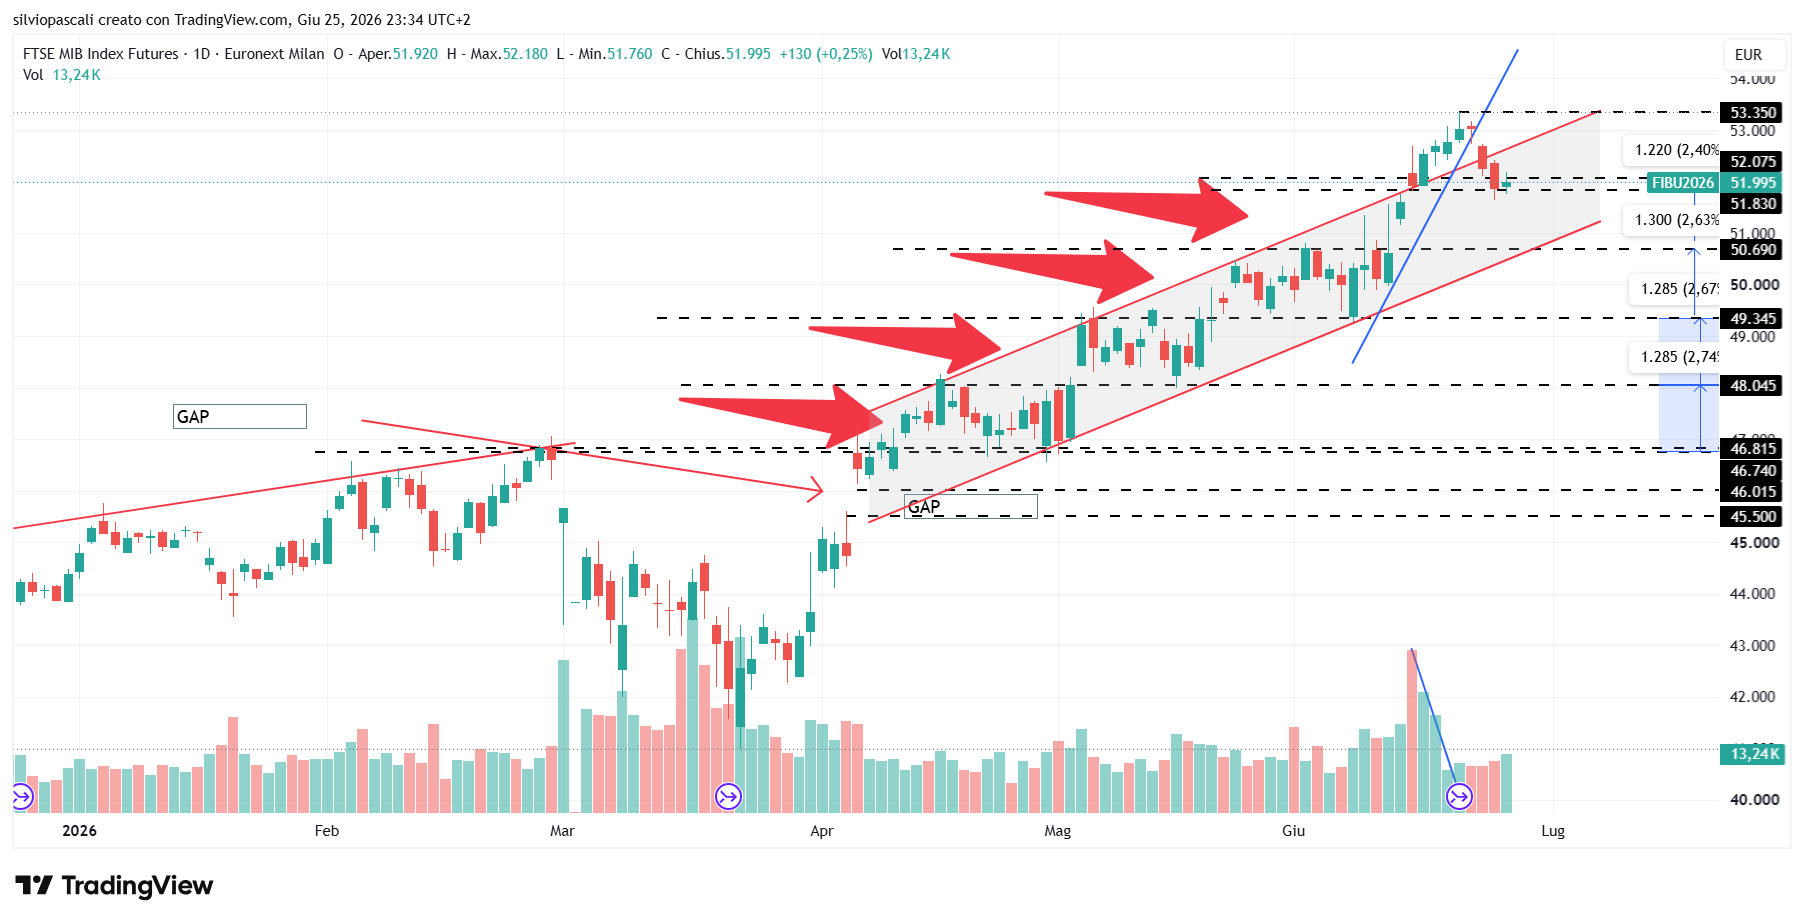
Unlike the FESX, the Italian future concluded a very low-volatility day that does not appear very significant and, at the same time, does not give any particular signs of recovery. Here too, we are at maximum levels and above the 51830 support. A downside break of this level could activate our BEARISH scenario with a target of 50690, which would correspond to the lower part of the medium-term rising channel (in red on our chart). Conversely, 53350 would be the level to violate to activate our BULLISH scenario.
DAX Index
Technical Analysis & Operational Framework
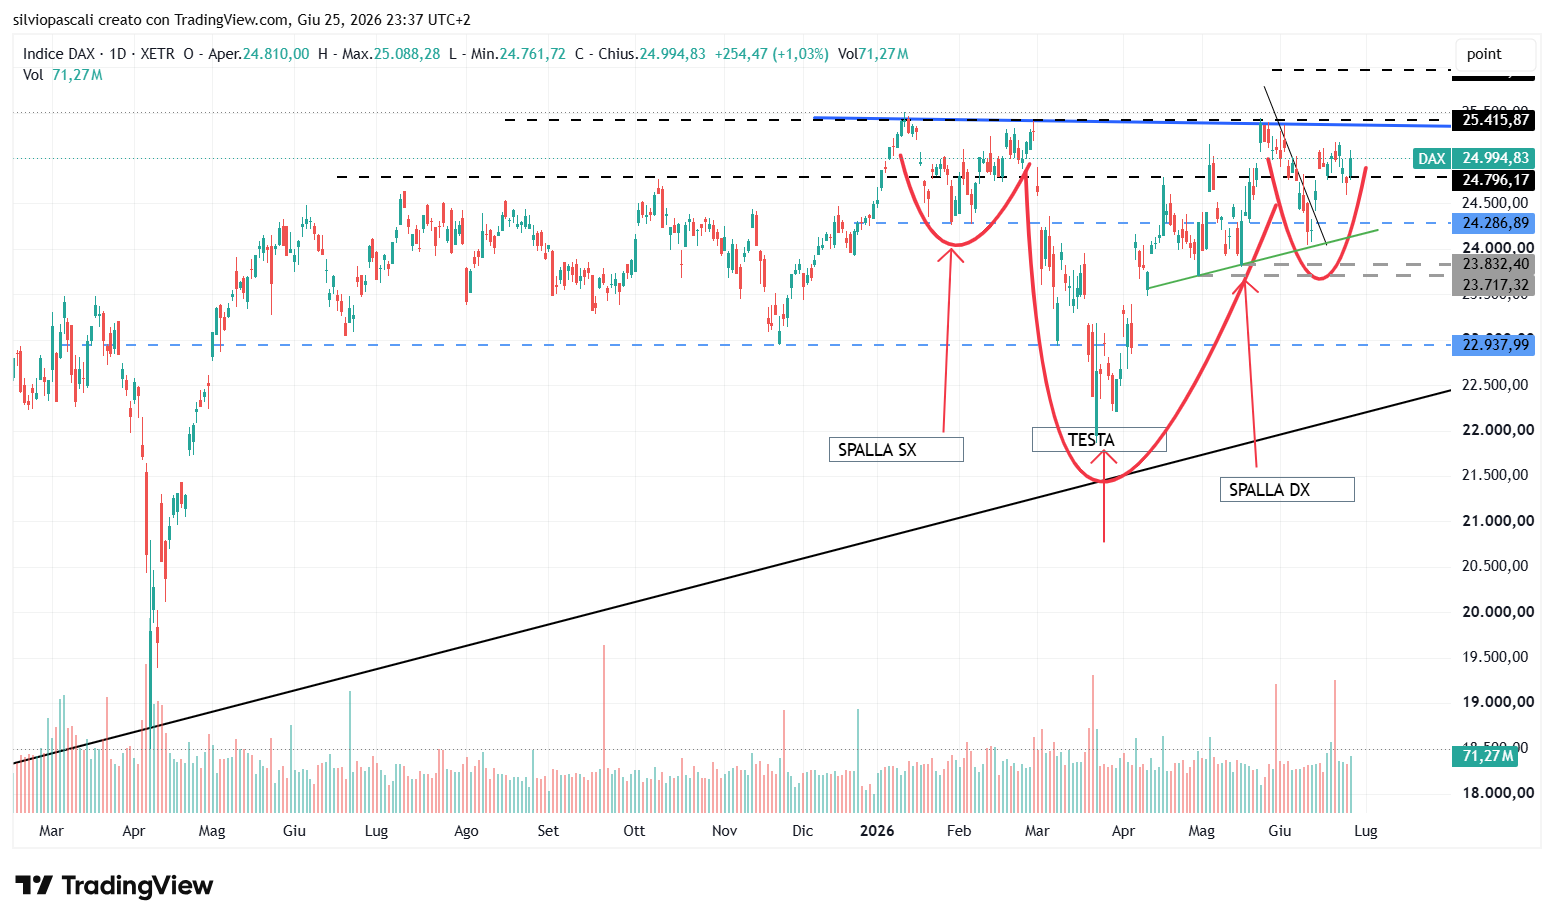
An excellent recovery by the German Index rekindles hopes regarding the completion of the bullish head and shoulders pattern, which, as we have described multiple times in recent days, remains atypical due to the preceding sideways trend and also because of its very large size. In any case, the trendline (in blue on our chart) will mark the eventual validity of the bullish pattern.
U.S. 10-Year Treasury Yield (US10Y)
Technical Analysis & Operational Framework
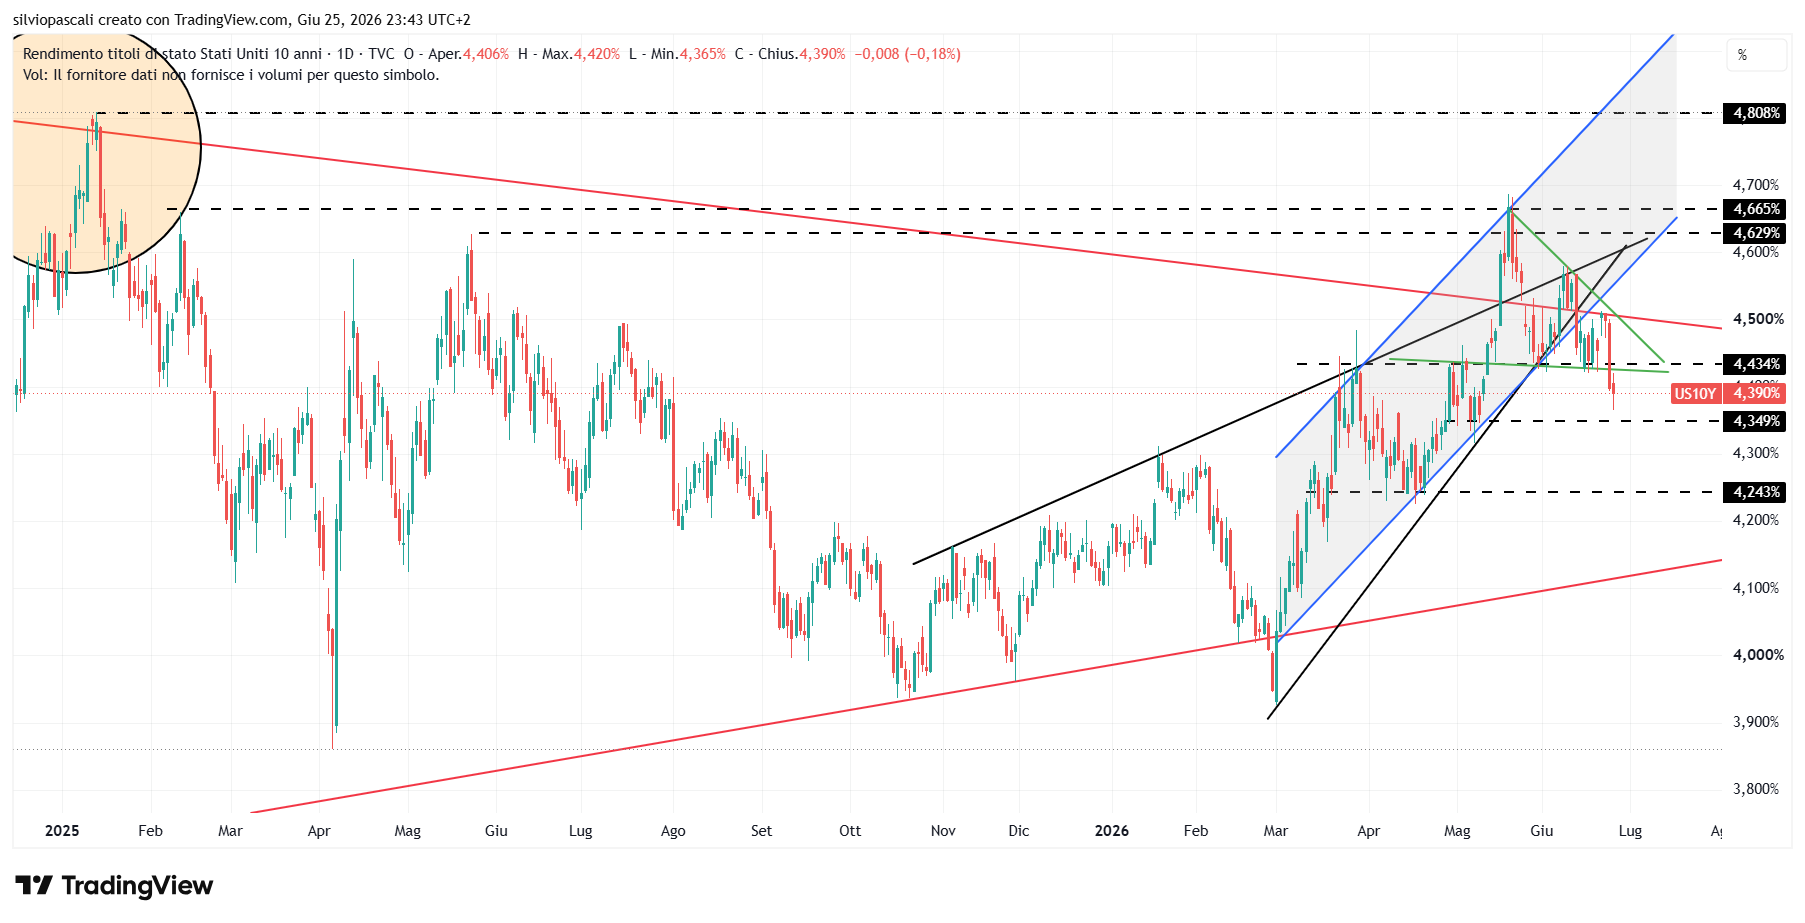
Today’s movement confirms what was said yesterday regarding the correction of the triangular pattern or the completion of the pullback on the lower part of the rising channel (in blue on our chart). In any case, whichever pattern we want to refer to, the 4.4344% support was a rather important level, and the U.S. yield remaining below this level confirms our BEARISH scenario with a target of 4.35%/4.24%.
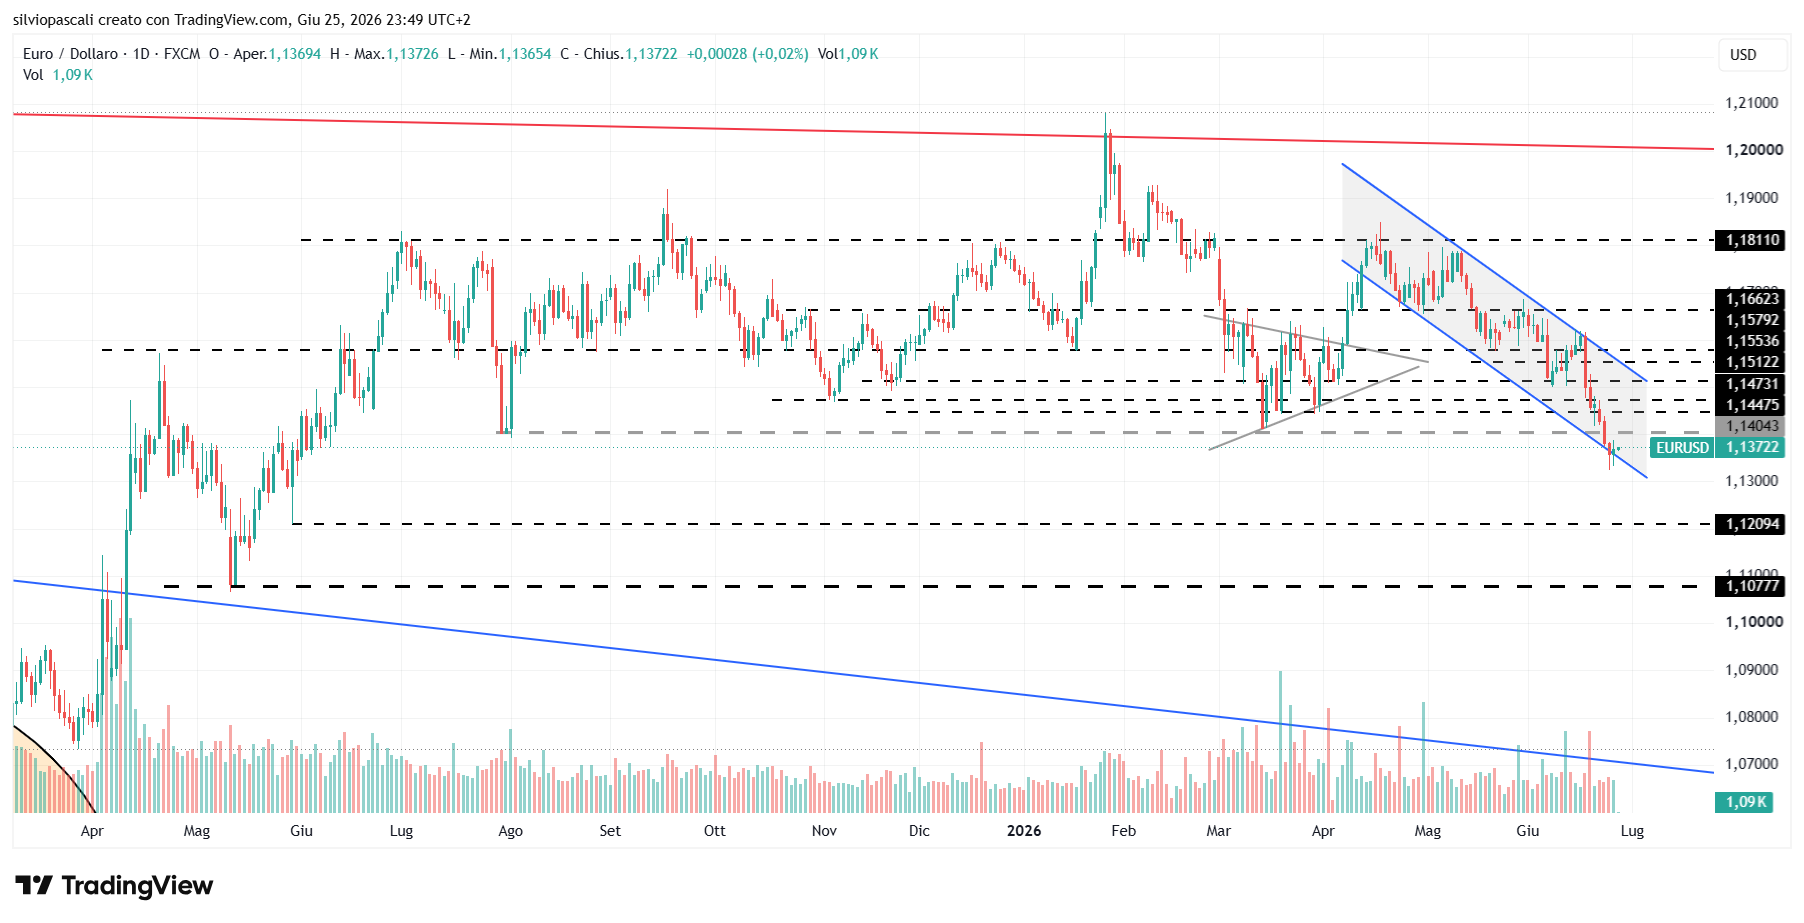
EUR/USD
Technical Analysis & Operational Framework
Today’s movement confirms what was said yesterday and also confirms the adaptation of the descending channel on our chart. We think a repositioning of the exchange rate on the upper part of the channel itself is possible. This does not mean that we expect a significant rise, but probably a sideways movement that allows a repositioning on the upper part of the pattern. For now we remain BEARISH, although confirmation of a possible sideways movement could arrive as early as tomorrow.
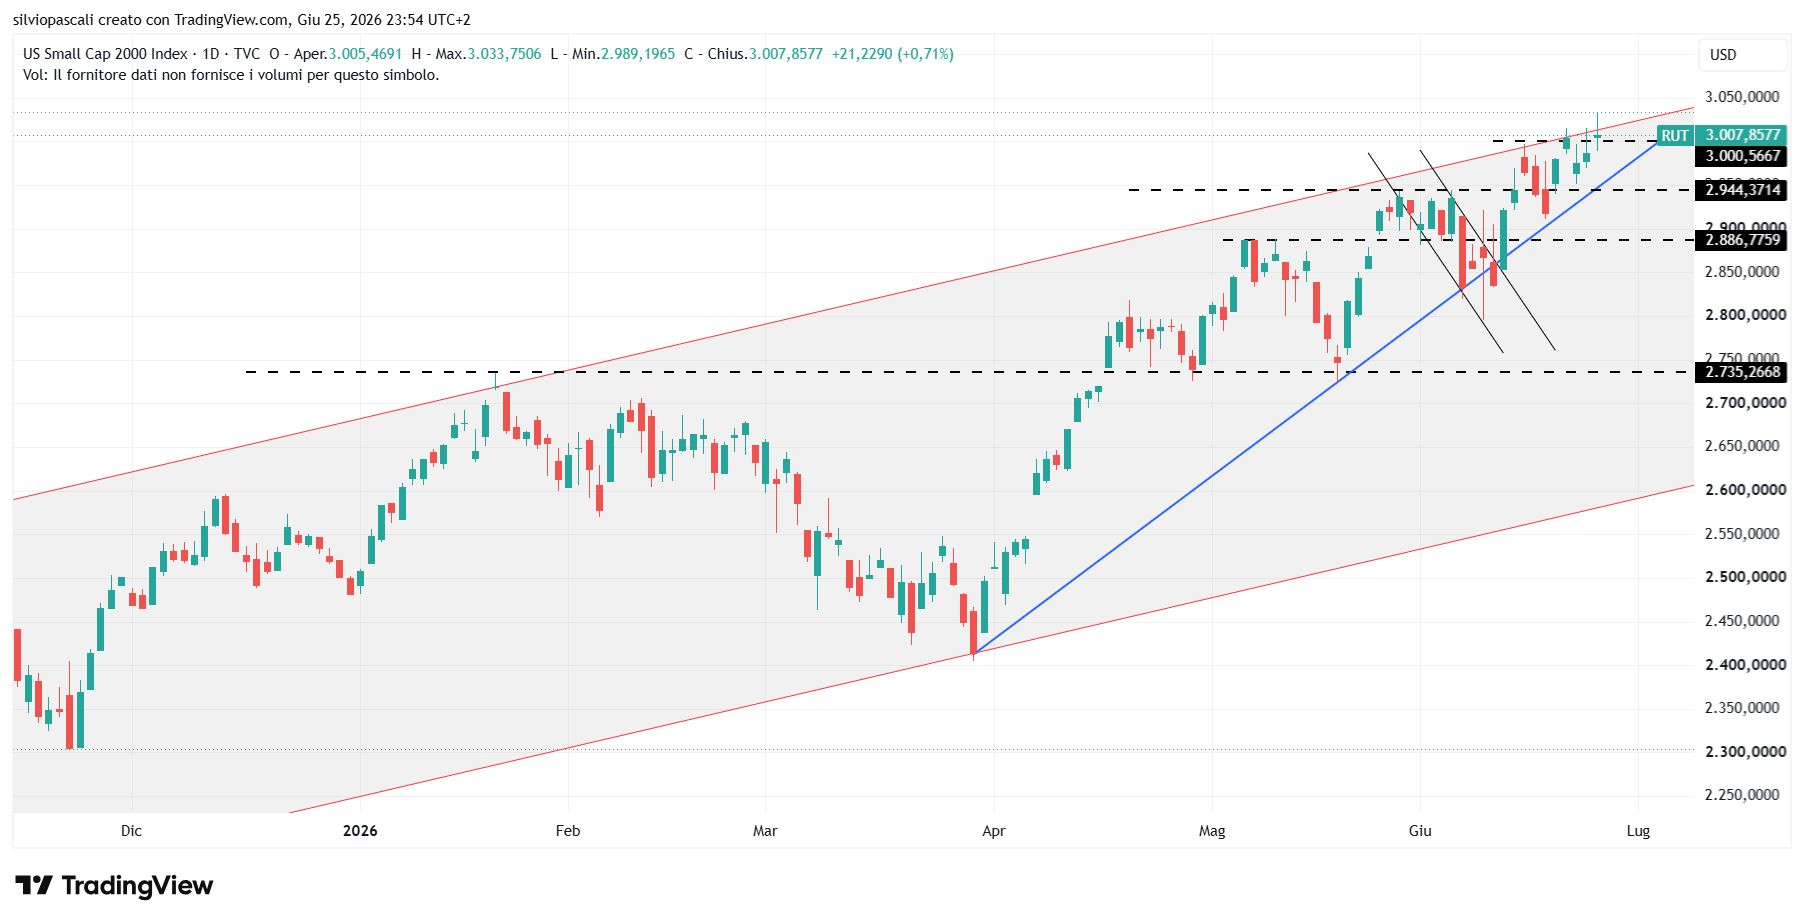
Russell 2000 Index (RUT)
Technical Analysis & Operational Framework
A decisive sign of strength from the American small-cap Index, which remains above the psychological threshold of 3000 points but, however, does not give a clear directional signal, remaining below the trendline that constitutes the upper part of the long-term rising channel and above the short-term rising trendline (in blue on our chart). We remain NEUTRAL and wait for clearer directional signals.
This article is for informational and educational purposes only and reflects my opinions as of the publication date. It is not investment advice, legal advice, tax advice, or a recommendation to buy or sell any security. I may hold positions in securities discussed, and my views may change without notice. Readers should do their own work and consult their own advisors before making investment decisions.