

DAILY INTERMARKET ANALYSIS (25/06/2026)
S&P 500 Index, Nasdaq 100, Brent Crude Futures, Bloomberg Commodity Index, EuroStoxx 50, U.S. 10‑Year Treasury Yield, Euro / U.S. Dollar, RUSSELL 2000


S&P 500 Index (SPX)
Technical Analysis & Operational Framework
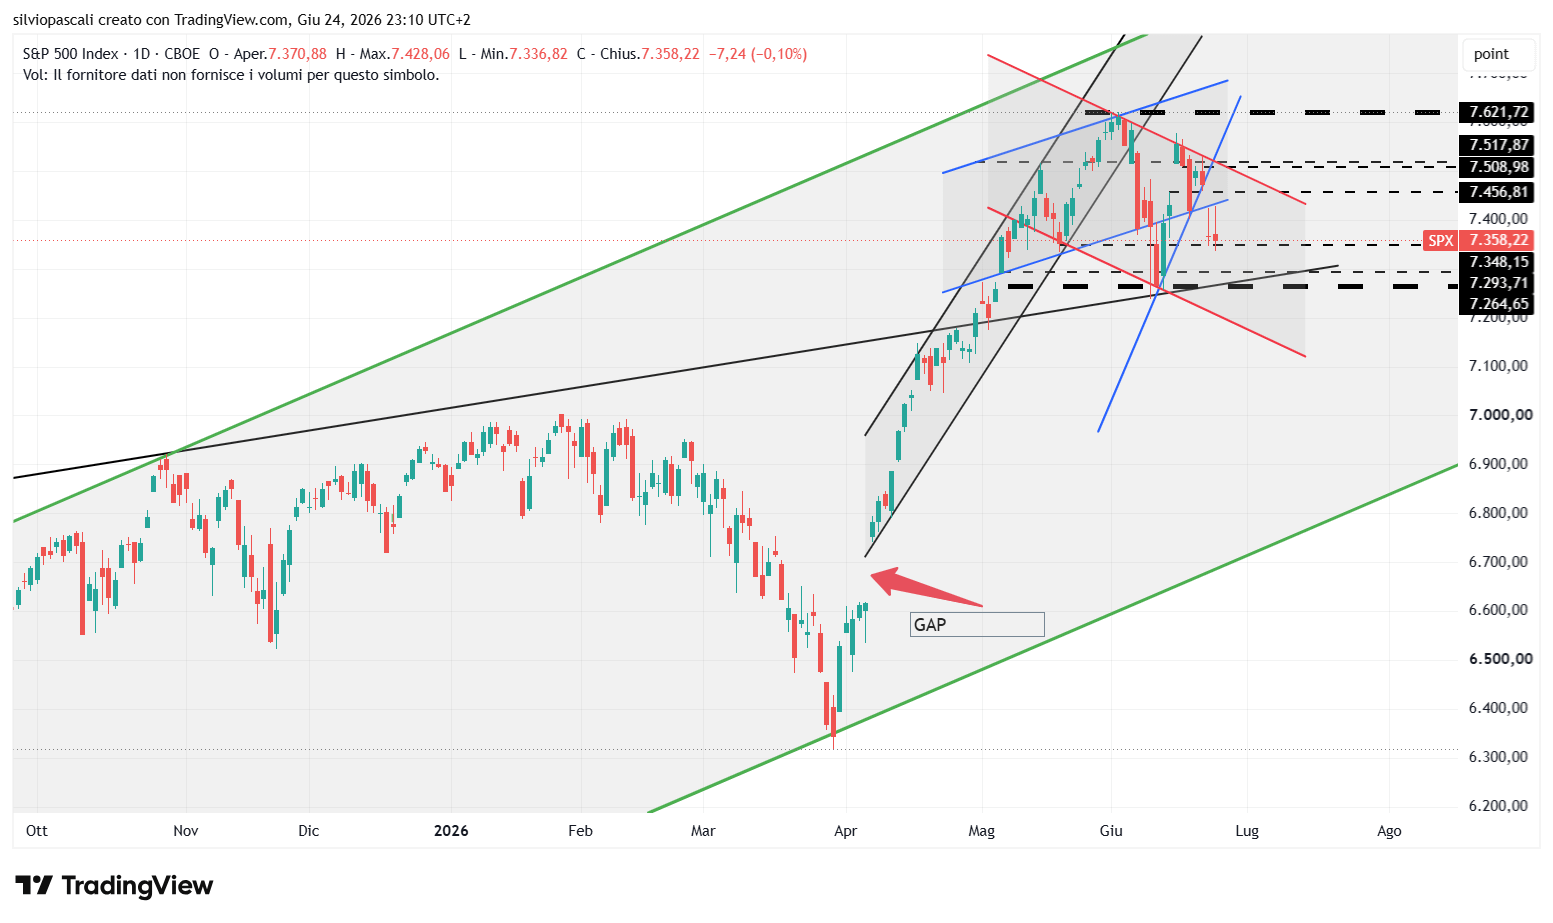
Today’s movement, although recovering near the end (and also after-hours), does not deviate much from yesterday’s close. We are still above the 7348 support, but the technical picture remains quite negative even though, as we reminded yesterday, we are still very close to the highs and within a range that, although wide, is still fairly sideways. The BEARISH scenario follows the descending channel (in red on the chart) with a target currently in the 7200 area. The previous support in the 7290 area will be decisive. This same channel will be used to evaluate the sustainability of any potential recoveries toward the highs.
—————————————————————————————————————-
Nasdaq 100 Index (NDX)
Technical Analysis & Operational Framework
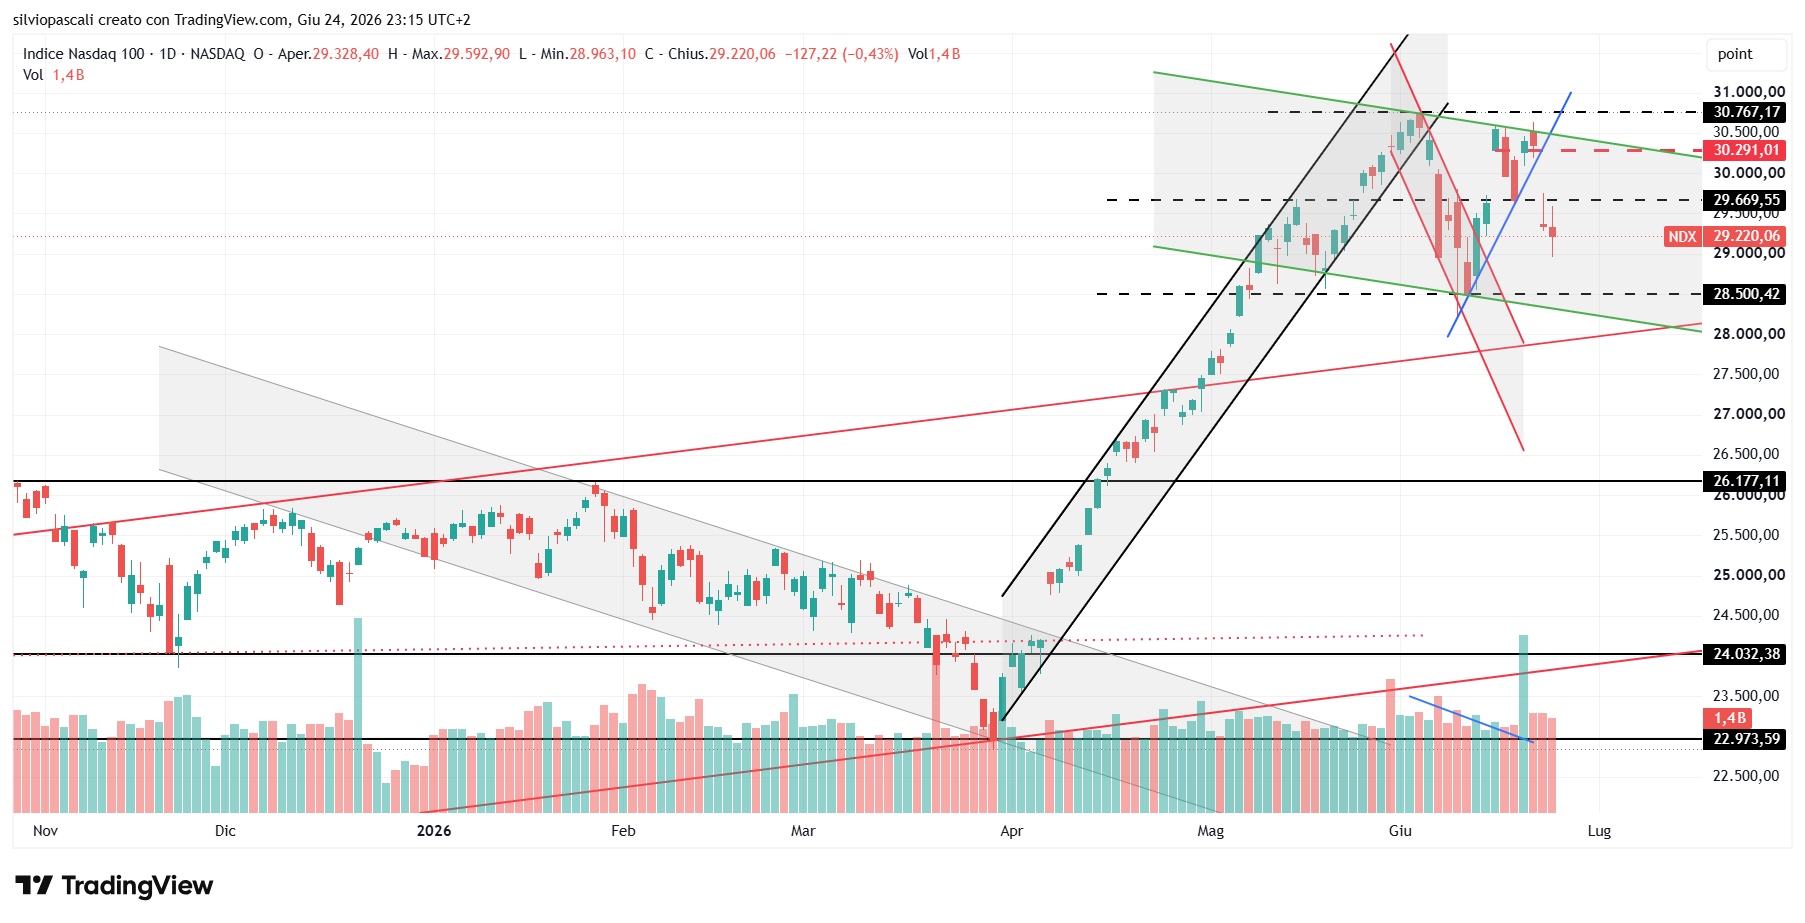
The recovery at the end of the day (and also post-close) does not substantially change the technical picture, which remains set slightly to the downside according to our channel (green on the chart) which we will follow in any potential correction. Therefore, 28500 is the first support and then the lower part of the pattern, currently in the 28280 area. Given the width of the pattern, we could have high volatility and numerous false signals. This same channel will be used in case of a break and upside to evaluate any potential BULLISH scenarios.
Brent Crude Oil Futures (BRN1!)
Technical Analysis & Operational Framework
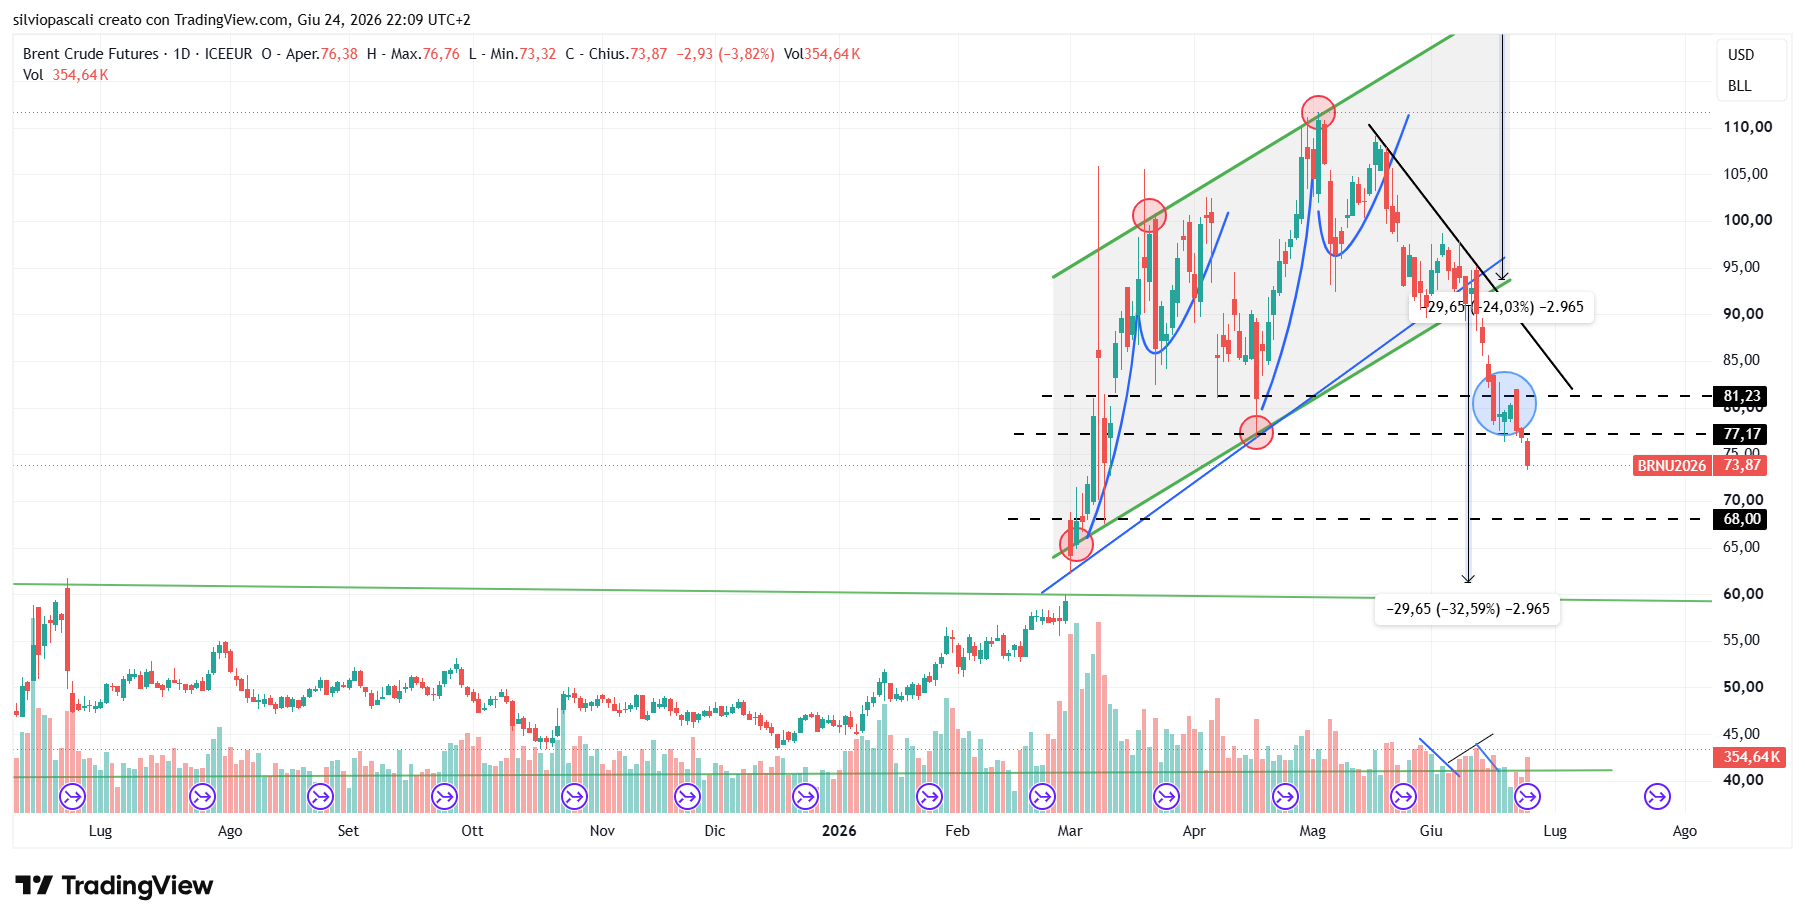
Today we record the break of the support level where the Future had stopped for a few days. The technical pattern we talked about two days ago is confirmed. The future is heading towards its target represented by the width of the channel in which it fluctuated throughout the period of the oil crisis, targeting the 61.2 area, but first at 68.
Bloomberg Commodity Index (BCOM)
Technical Analysis & Operational Framework
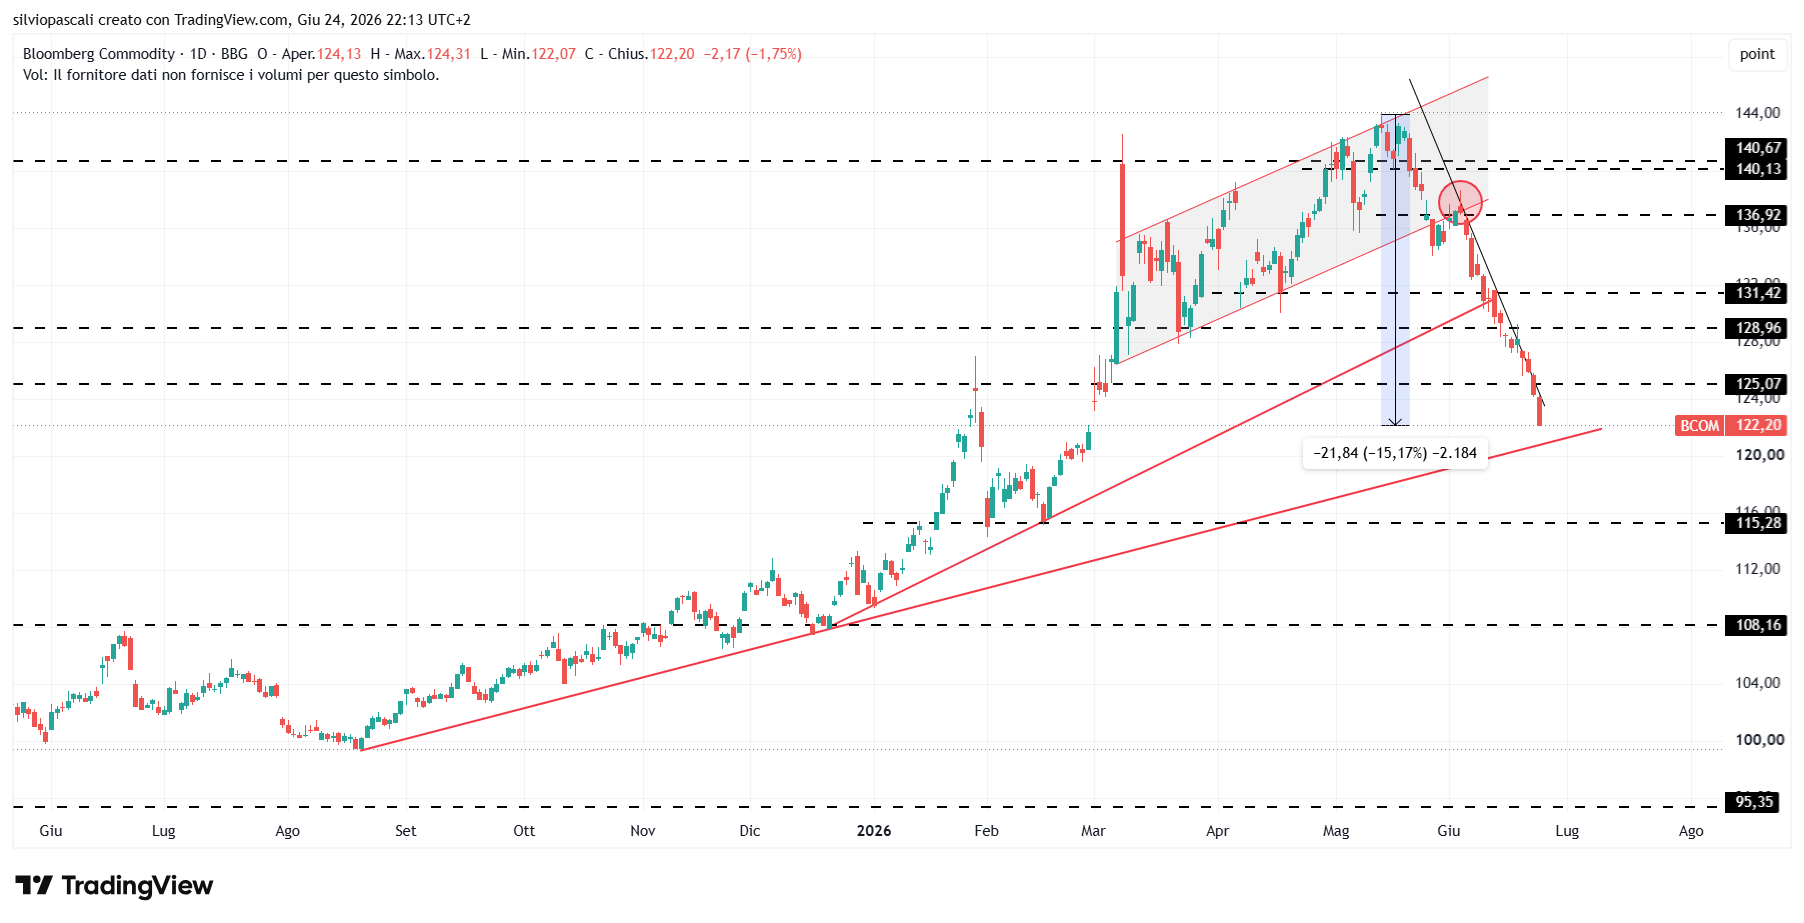
Today’s sharp correction extends the downtrend, which is now 15% off its highs. The downside break of our rising trendline (in red on our chart) significantly worsens the scenario. Support is currently in the 120.8 area, and any potential break projects the Index to 115.3. We choose to remain BEARISH.
Euro Stoxx 50 Index Futures (FESX)
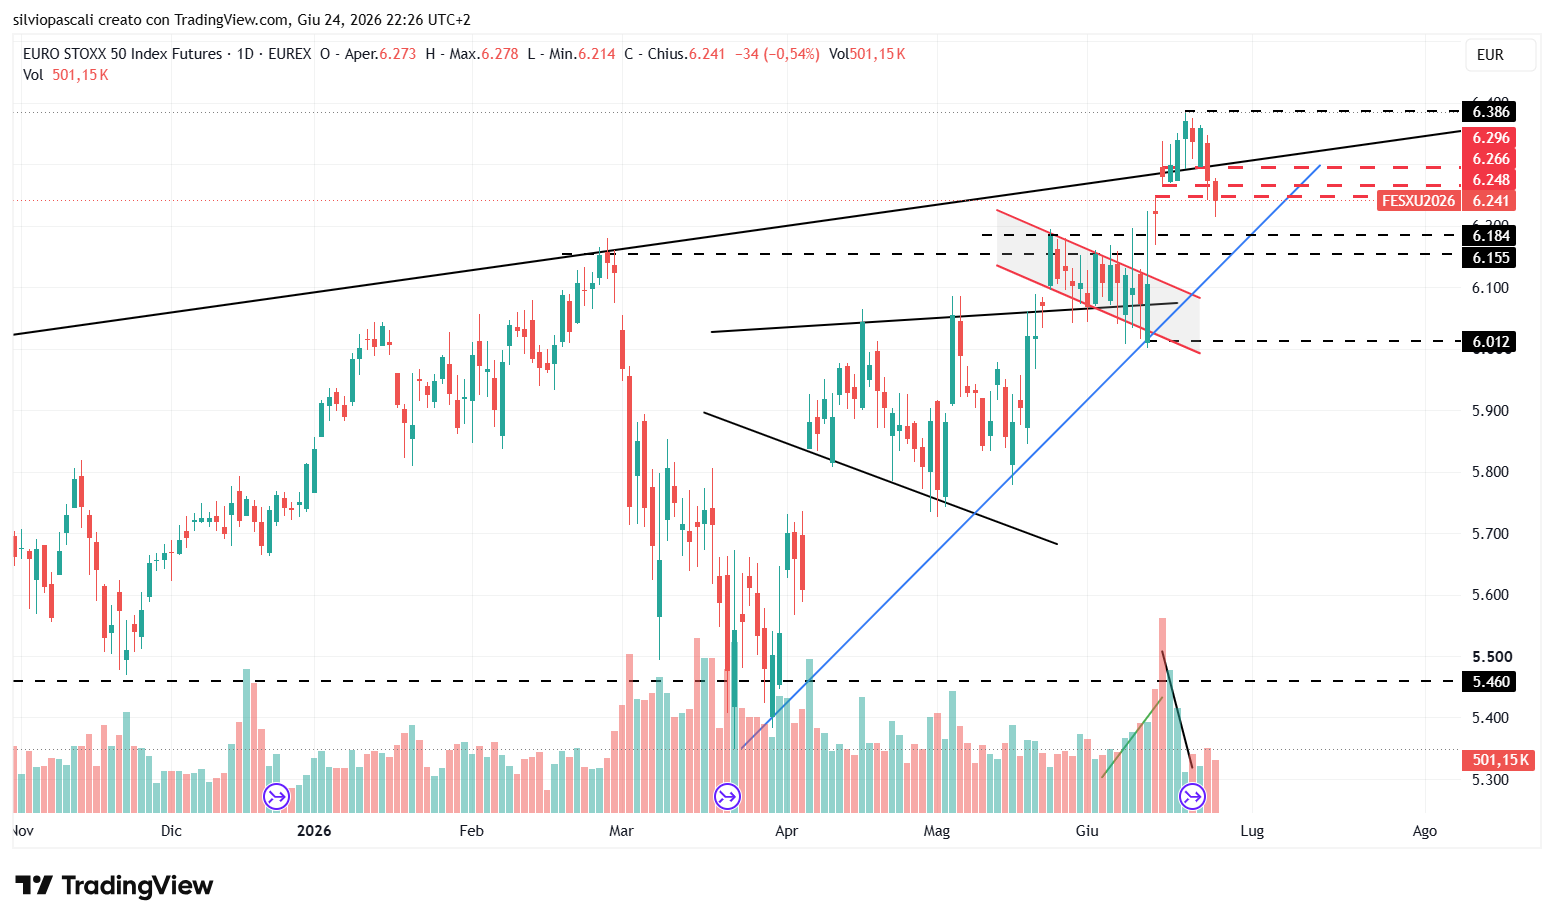
Technical Analysis & Operational Framework
Today’s correction goes beyond the second support at 6248. A likely movement will bring the European future onto our rising trendline (short-term, in blue on our chart). We choose to apply our stop and return NEUTRAL. We will return BEARISH only upon a potential break of the trendline (in blue on our chart) and BULLISH upon the break of the static resistance at 6386.
FTSE MIB Index Futures (FIB1!)
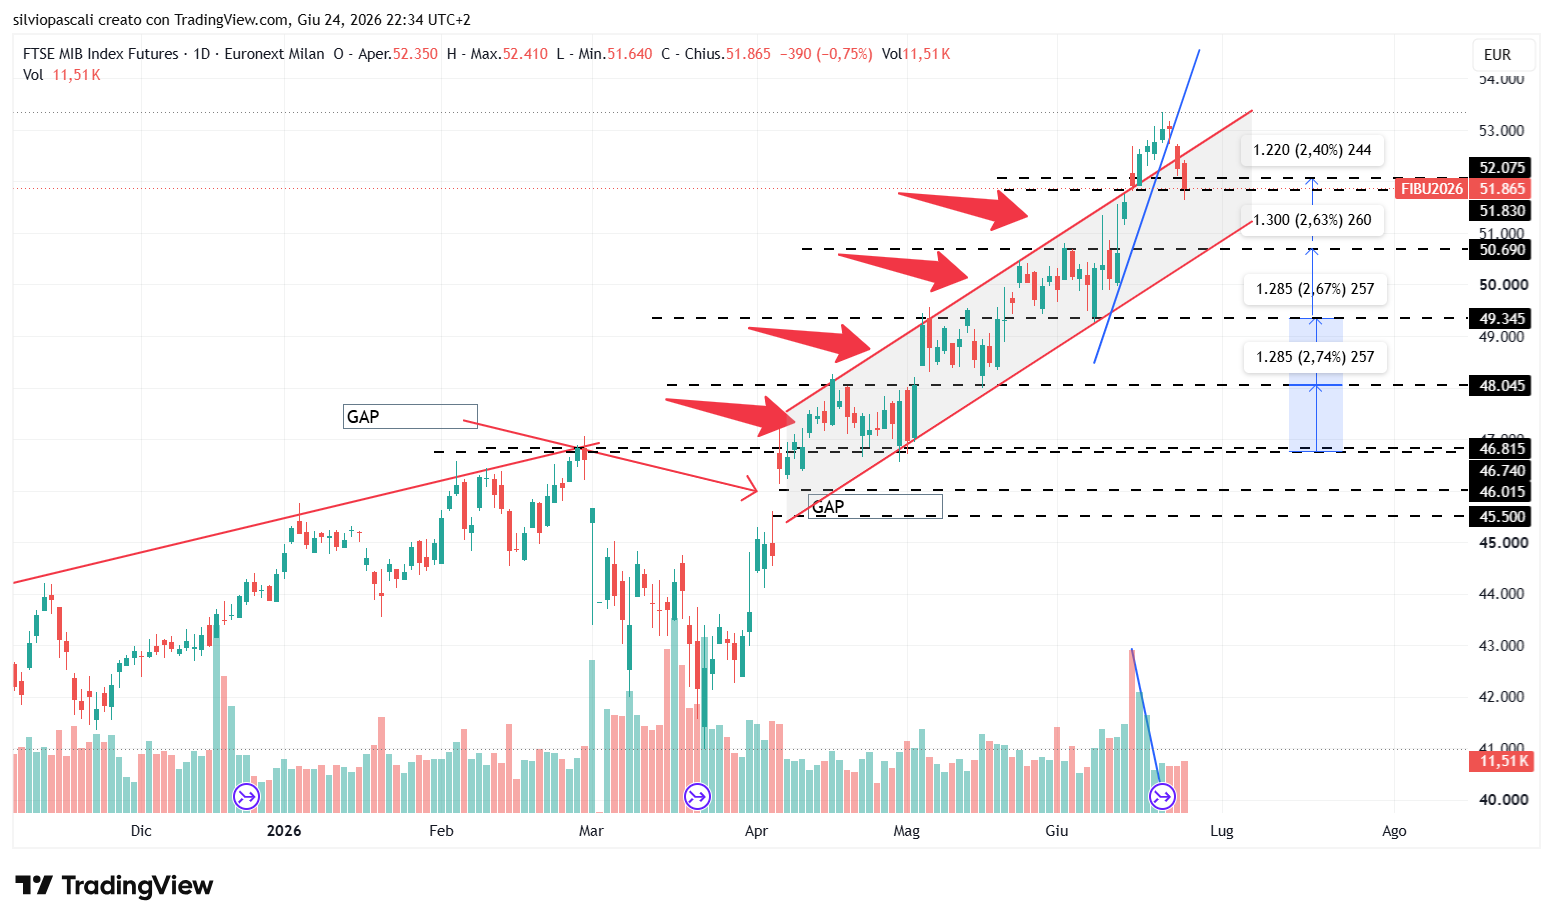
Technical Analysis & Operational Framework
Today’s correction is a negative signal. We have established a new support level at 51830, but a potential downside violation tomorrow and a repositioning on the lower part of the rising channel (in red on our chart) would be more than likely. Conversely, holding this level could reopen bullish scenarios and a return to the highs, which in any case are not very far away. We remain NEUTRAL because the trend remains barely directional and still highly volatile, enough to generate false signals like the ones seen on the Eurostoxx.
DAX Index
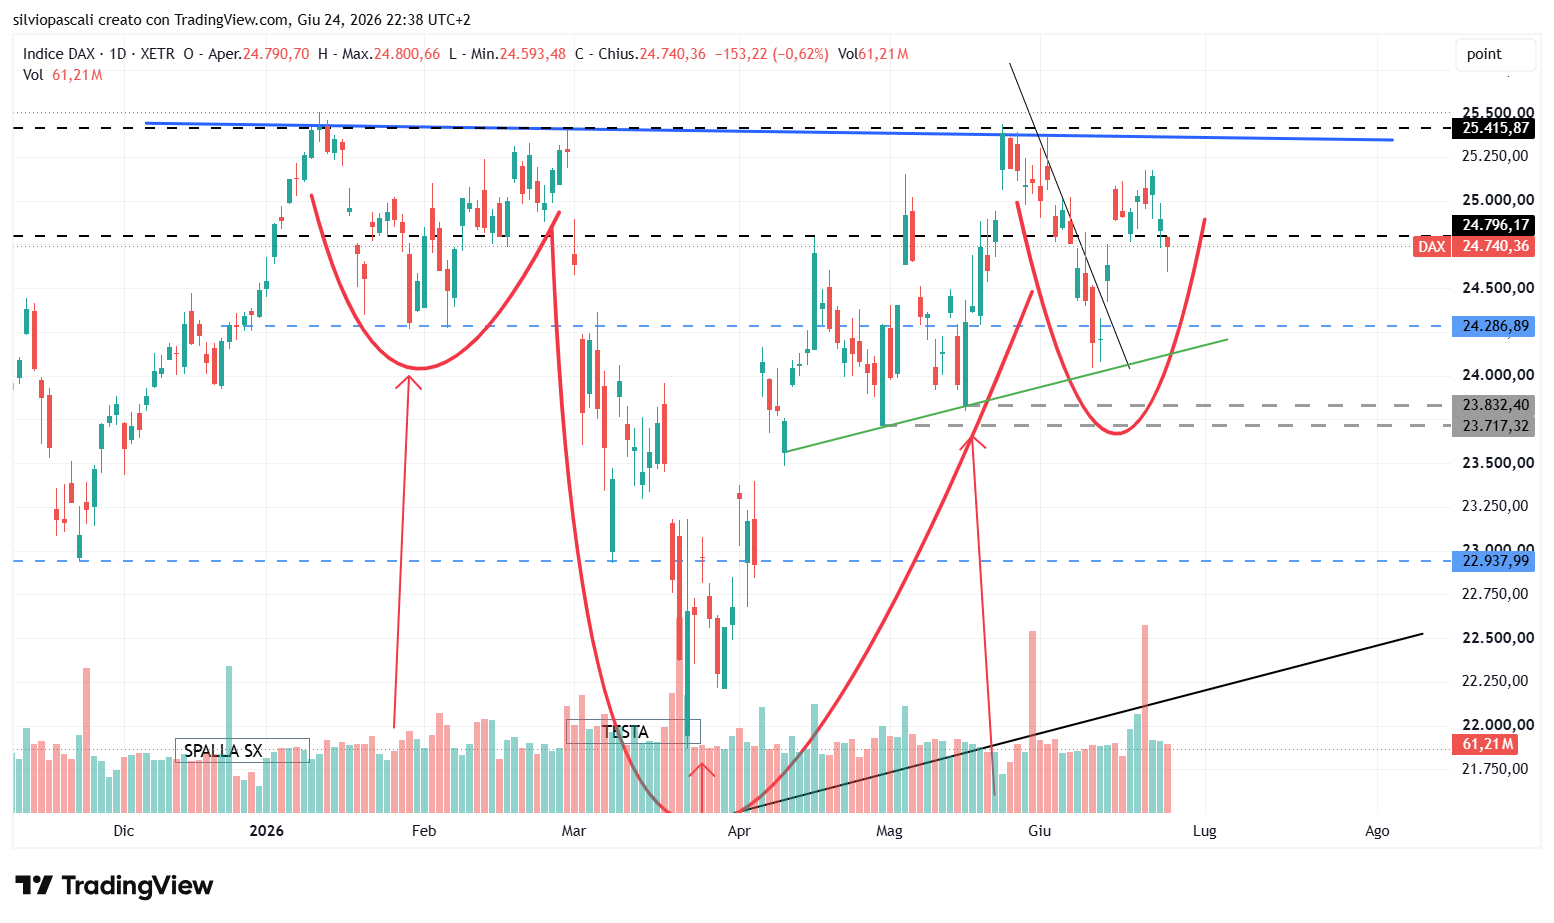
Technical Analysis & Operational Framework
Today, just a few points away from the neckline, a clear signal of the exhaustion of the bullish momentum arrives. We are observing a pattern that is inherently anomalous due to the preceding sideways trend and, in any case, also because of the size of the pattern itself. We will wait over the coming days because completion is certainly still possible.
U.S. 10-Year Treasury Yield (US10Y)
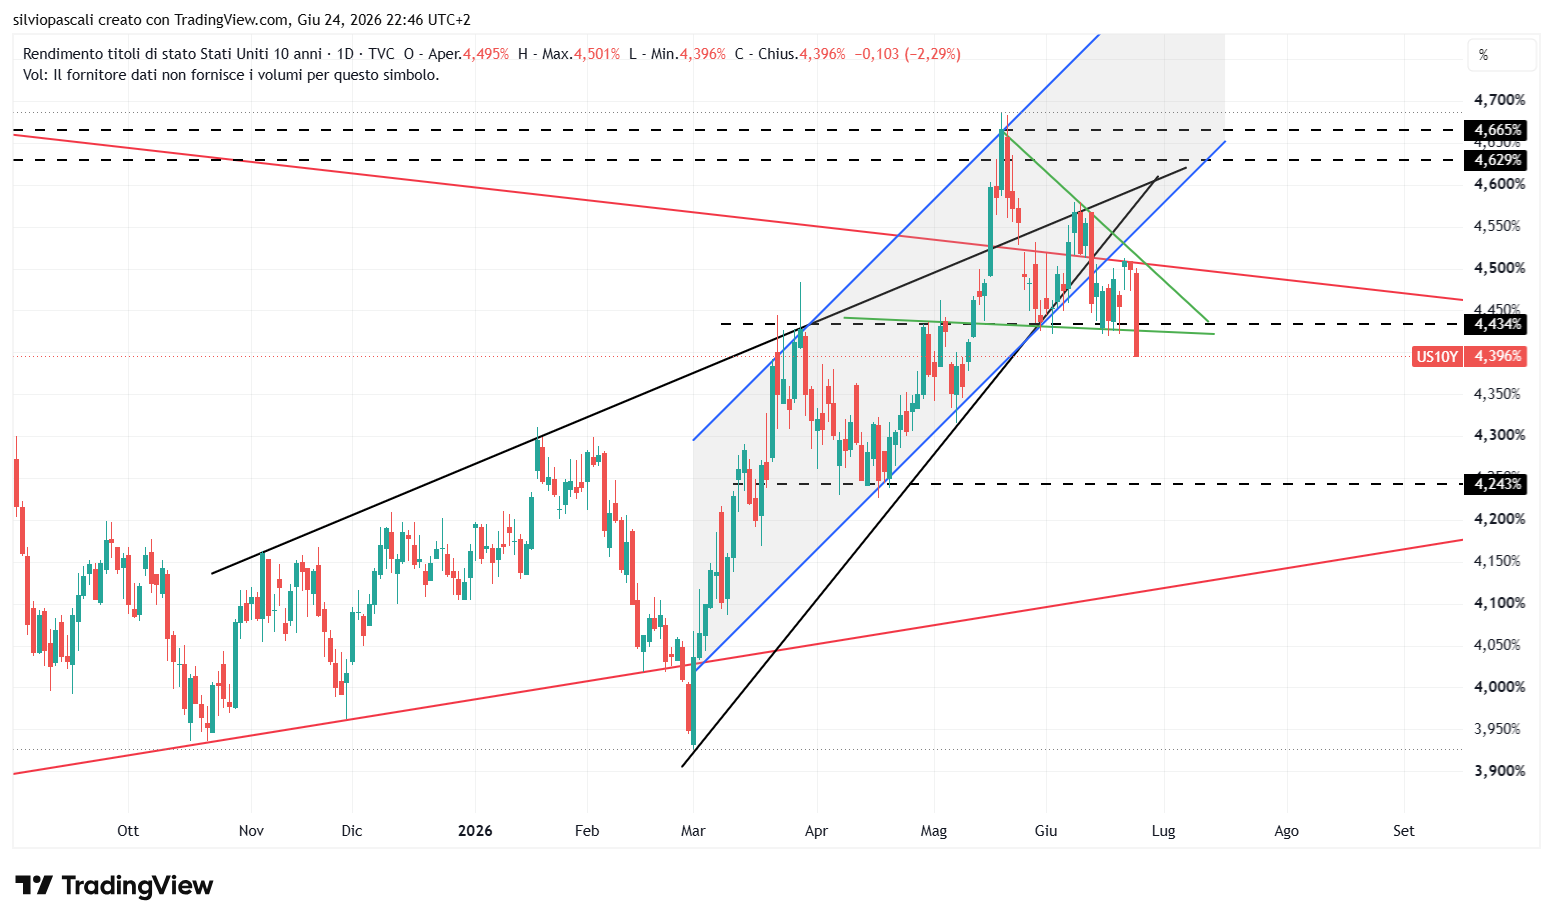
Technical Analysis & Operational Framework
Today’s broad correction in the U.S. 10-year yield is certainly very significant. From a charting perspective, we can again refer in the long term (the chart we put first) to the extended triangle into which the yield has returned (in red on our chart). We could imagine a correction down to the base, currently around 4.14% and rising. Turning instead to the short term, with today’s movement we have validated the channel (blue) and also the triangular pattern, which at the tops of a movement also becomes a reversal pattern. Tomorrow’s opening and therefore sustainability below the important support of 4.434% projects the yield onto the supports at 4.24% and 4.116%.
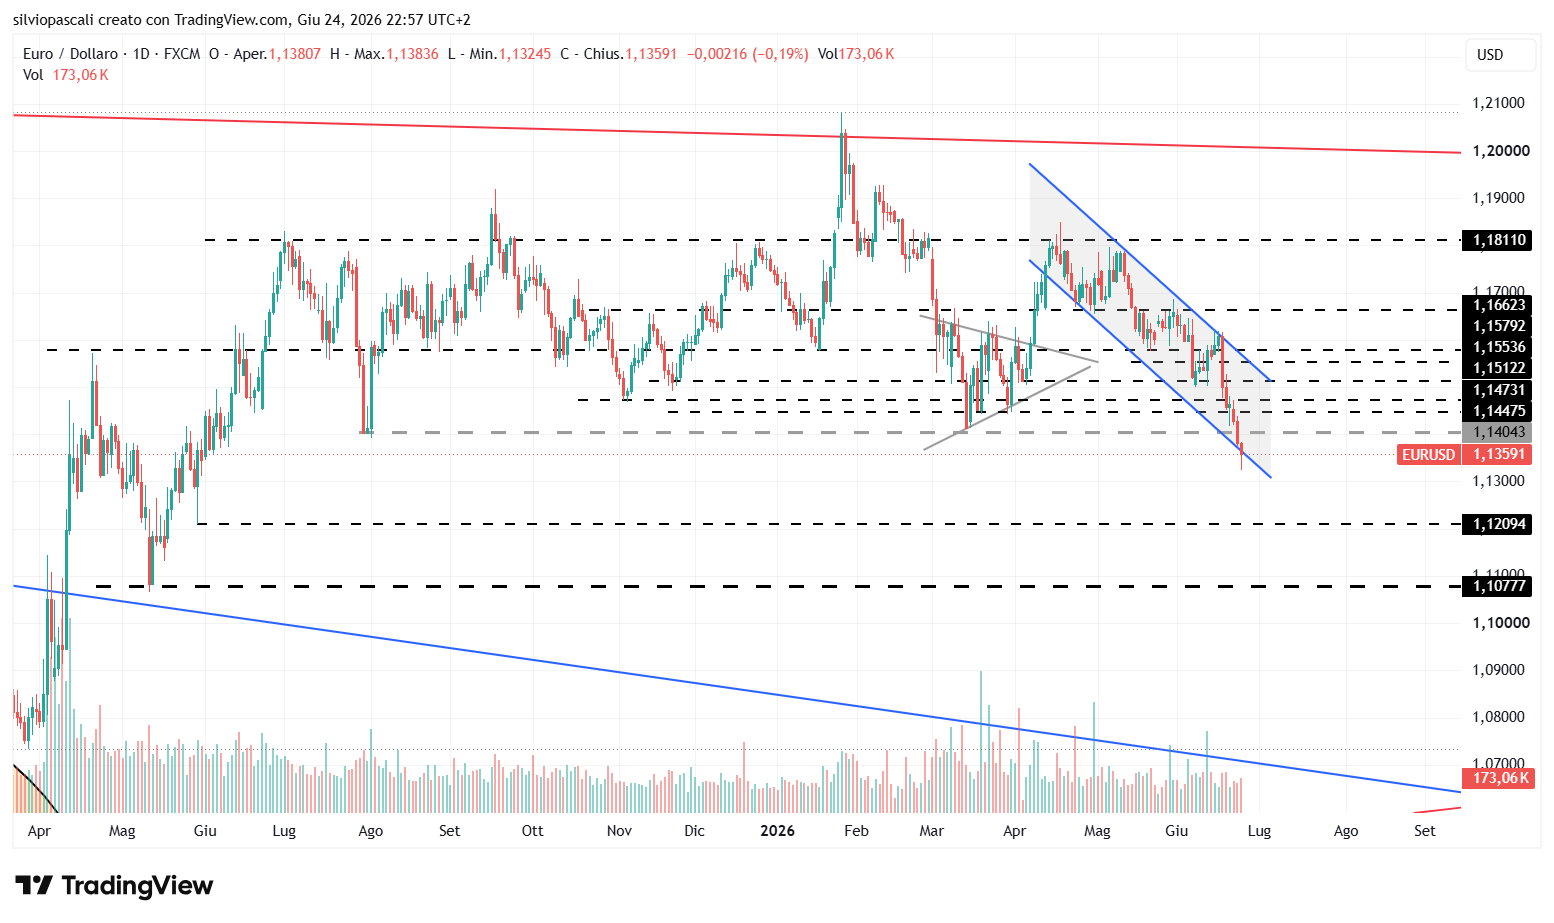
EUR/USD
Technical Analysis & Operational Framework
Yet another correction today for EUR/USD. As said in recent days, remaining stably below the 1.1404 level would have decisively worsened the technical picture. We expect the correction to continue with targets as ambitious as 1.21 and, in case of a violation, at 1.11. We have adapted the channel (blue). The corrective movement could still be contained within that channel and consequently decrease its bearish strength.
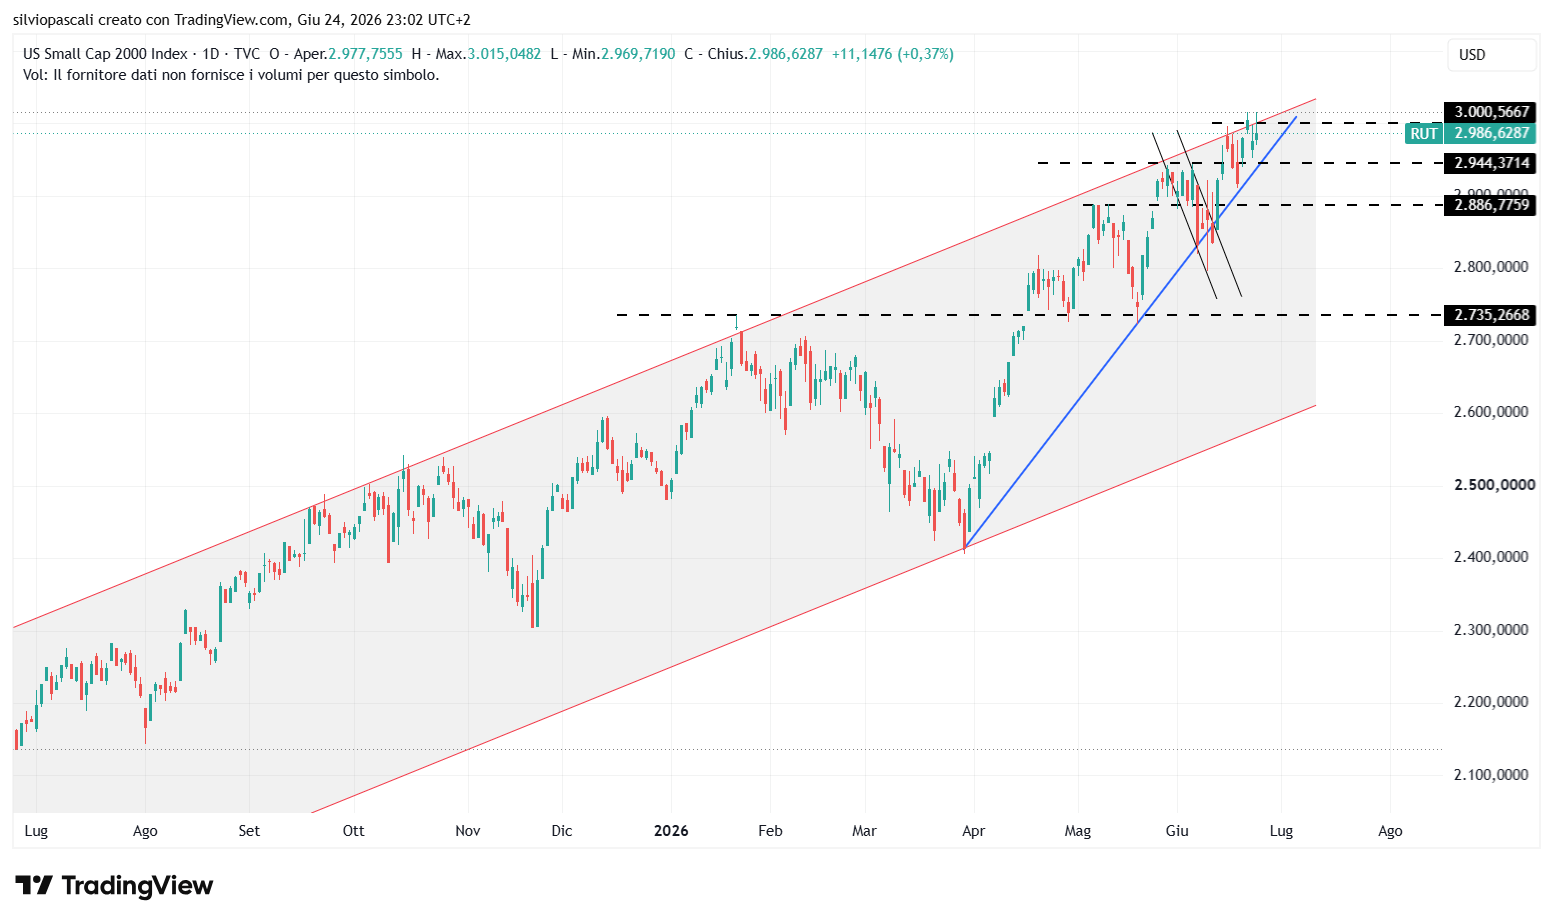
Russell 2000 Index (RUT)
Technical Analysis & Operational Framework
Once again today, the test of 3000. From a charting perspective, the American small-cap future is at the apex of a triangular formation and, at the same time, inside a channel where it is forming a compression zone. We are therefore waiting for better directional signals that could bring the future back to the lower part of the channel or accelerate the trend and break to the upside, with an almost vertical trend, the upper part of the pattern itself.
——————————————————————————————————————
This article is for informational and educational purposes only and reflects my opinions as of the publication date. It is not investment advice, legal advice, tax advice, or a recommendation to buy or sell any security. I may hold positions in securities discussed, and my views may change without notice. Readers should do their own work and consult their own advisors before making investment decisions.